|
5 Distressing Facts You Probably Don’t Know About Social Security
1. Cash Negative: Social Security went cash negative in 2010, five years earlier than anticipated, according to the Brookings Institute. 2. A Big Percentage of the Federal Debt: Social Security adds to the federal debt every year. The current amount of debt that is attributable to “Intragovernment Holdings” (the name given to various federal accounts, including the social security trust fund) is $5.5 trillion and growing. The total U.S. public debt is $19.8 trillion (as of 5.26.17). The social security trusts (and a few other accounts) add up to 27.8% of the debt. 3. Tax Cuts and GDP Growth Are Unlikely to Fix It: According to Fitch Ratings (in a press release in 2016), “The most immediate fiscal challenge is to restore the social security system - largely unaddressed by 2016 budget proposals - to a more sustainable state.” On May 25, 2017, Charles Seville, Fitch Ratings senior director and lead analyst on the US sovereign rating, wrote that “The President’s Budget’s proposal to eliminate the federal deficit and reduce the debt/GDP ratio over 10 years rest on an optimistic long-run growth assumption of 3%, which is unlikely to be realized.” Tax cuts are unlikely to generate a lasting and substantial boost to growth, in Fitch's view. 4. The Disability Fund Dried Up in 2016 and is Borrowing from Social Security. The Disability Insurance Fund has been borrowing from the Old Age and Survivors Insurance (OASI) Trust Fund since 2016 – just before the DI Fund was depleted (source: Social Security Administration). The DI Fund is predicted to be drained dry in 2022 (in just 5 years), if no changes are made. 5. Tapped Out in 17 Years. The Social Security Funds are predicted to be depleted by 2034, unless measures are taken to shore the funds up. The last time this was about to happen, in 1983, Congress saved the day with measures that are not predicted to work as well this time. This also assumes that the fund depletion doesn’t move faster than predicted, as happened when the Social Security system went cash negative in 2010. With one bonus, Social Security Note. Should You Wait Until Age 70 to Retire? It’s easy to see why the government website and many mainstream media outlets encourage people to wait until 70 to retire, under the rationale that waiting offers you a larger annual stipend. Waiting to retire helps the system stay afloat. However, if you do the math, then you realize it takes 12-20 years to make up the amount you forego when you wait that long. (If you wait until 67 to retire, instead of age 62, you could be giving up $100,000. If you wait until age 70, you could be passing up over $200,000.) If you’re an active income-earner, it won’t add up to retire early, when you could earn your full salary instead. However, if you’re out of work, the early retirement could be a Godsend. Incidentally, the Brookings Institute reminds us that public pensions went cash negative over 25 years ago, in 1985. (2003 was one year when distributions were less than contributions, however, the majority of the time has been in the red.) The bottom line is that if you’re counting on getting a fat check from your company or the government in retirement (or disability), your expectations are likely to hit a reality check in the years to come. Many pensioners, particularly those in the auto manufacturing and airlines industries, have already learned this the hard way – having received a big cut in the pension, health care and other post employment benefits that they were promised, but are not receiving. Private pension promises are rewritten and cut in bankruptcy proceedings. Politicians are having a hard time announcing reform to the public pension system, which is one of the big reasons why the U.S. debt is increasing each year. The bankruptcies in the private system remind us that borrowing from Peter to pay Paul always has an expiration date. Let’s hope we can all come together to resolve the problems before that happens. Until then, it’s a good idea to have a Plan B for your retirement future. There are many ways that you can do a better job of providing for your future, while living a richer life today, by shoring up your assets, and making smarter choices in your energy, budget and savings expenses and strategy. Call 310-430-2397 to learn more about Natalie Pace’s:
Financial Engineering. Good math goes a long way in today’s world. It has been fueling the rise in the stock market, and it is also helping to make ends meet for the U.S. Federal Government. For instance, if you wait to retire until you are 67, the Social Security Administration will give you XYZ benefit level, and even more if you wait to 70. On the face of it, waiting looks like a good idea. However, if you do the math, you’ll realize that it will take you 20 years to make up the losses of waiting until you’re 67 to retire – longer than most people live. (Something that is never mentioned in the glossy brochure or blog.) That’s great for the U.S. (and “us”), but not so good for you individually, particularly if you are 62 and out of work. And that’s the issue with stocks, too. The boom/bust economy that we’ve been embroiled in during this new Millennium can be great in the short term, but costs everyone dearly in the correction (which has been happening in an 8-year cycle since 2000). In 2000, Dot Com companies were given the cheap, easy money, resulting in a 78% correction in the NASDAQ Composite Index that took 15 years to recover from. Prior to the Great Recession, money flowed into liar loans, subprime and real estate, costing the Dow Jones Industrial Average a drop of 55%. The American taxpayer had to bail out the banks, insurance companies and brokerages, and over seven million people lost their homes. 5.4 million homes are still seriously underwater and the debt in the developed world has become astronomical (at $20 trillion in U.S. public debt and over $65 trillion in U.S. total debt and loans). This hits Main Street the hardest, since the “smart money” always moves out first. So, where is the cheap, easy money flowing these days? Who is benefiting, and what will be the ultimate cost? The short answer is that corporations are getting the bulk of the money. They are buying back their own stock, which pushes up the stock market. Just as Internet companies couldn’t get to cash break even in 2000 (despite an inflow of investment money), many legacy companies are suffering from sluggish sales and drowning in debt, pensions and other post employment benefits – something that borrowing money doesn’t correct. Large corporations have been borrowing money very cheaply and using it to push up the value of their own stock, rather than investing in new products, people or productivity. Here’s how the financial engineering works. Corporate Buybacks Look Great on Paper Because… The Share Price Stays High Earnings Look Higher Than They Are Price to Earnings Ratio Looks like a Bargain However, what is really happening is that … Share Price Stays High The share price is staying high because the company’s own buying makes it look like the stock is popular. Earnings Look Higher Than they Are Many companies buy back their own stock in order to make their quarterly earnings look good. How does this work? When you reduce the number of shares (as happens when corporations buy shares and take them out of circulation), the earnings per share goes up, even if the revenue (sales) is actually flat or even lower than it was a year ago. Price to Earnings Ratio Looks like a Bargain The Price to Earnings Ratio also looks more attractive when the share count is reduced. Investors think that the stock is on sale, and might be tempted to buy at what they perceive is a bargain price.  According to Howard Silverblatt, the senior index analyst for S&P Dow Jones Indices, corporate buybacks have boosted EPS by 20% over the last 4 years. The Smart Money Exits Quietly, First Corporate buybacks were down in 2016 and 2015, from the highs set in 2014 (which were on par with the highs set in 2007, before the Great Recession). The last two consecutive declines in buybacks occurred in 2008 and 2009 (when the Dow Jones Industrial Average dropped to a low of 6547). In spring of 2005 (two years before the subprime crisis), home builder CEOs were selling hundreds of millions of their company stock, including Angelo Mozillo at Countrywide, the Toll Brothers and the KB Home CEO. Over the last year, Apple insiders have taken profits on over $610 million in stock. Microsoft executives and directors have cashed out over $4.5 billion. Jeff Bezos (the CEO of Amazon) has sold over $1.7 billion of Amazon stock. The First Signs of Distress: Retail Bankruptcies The retail bankruptcies of the last few years have shocked consumers, but haven’t weighed on the stock markets – yet. Retailers continue to be at risk, with the threat of bankruptcy in the next 12-24 months looming for Sears Holding Company, Claire’s Stores, True Religion Apparel, 99 Cents Only Stores, Nebraska Book Company (for the 2nd time in five years), Nine West Holdings and Rue21 (source: Fitch Ratings). Payless declared bankruptcy on April 4, 2017. The loss of income for mall REITs can’t be good. Publicly traded mall REITs are heavily indebted, with Taubman Centers Inc. carrying a debt to equity ratio of 51 (source: Money.MSN.com). No One Ever Predicts a Recession In 2007, even as mortgage banks were going out of business in droves and the auto manufacturers were hanging on with backdoor borrowing from the U.S. Treasury, Treasury Secretary Henry Paulsen was still reassuring investors that the subprime mess wouldn’t affect the overall economy (source: Bloomberg, July 26, 2007). GDP growth predictions for 2009 were still 2-3% growth in June of 2008, even though Bear Stearns had already collapsed and Lehman Brothers, Washington Mutual, Merrill Lynch, AIG and many of the largest U.S. banks, insurance companies and brokerages were teetering on the edge of bankruptcy and negotiating behind closed doors for emergency capital to save their assets. Even after the bailouts, the October 2008 economic projections were still touting GDP growth. It wasn’t until January 28, 2009, just a month and a half before the bottom of the Great Recession, that the GDP growth predictions finally reflected negative growth. If you wait for the headlines that we’re in a recession, it’s too late to protect yourself. What’s Really Going On Behind the Scenes The basic analysis of what is really going on behind the scenes today is that everyone in most of the developed world (with rare exceptions), including governments, corporations and individuals, are borrowing from Peter to pay Paul. According to the Urban Institute, 1/3 of Americans with a credit score are in debt collections. It doesn’t take any amount of data to know that most of the people you know are struggling financially, buying less of everything, taking fewer vacations and being forced to come up with creative solutions for housing. Financial engineering (fuzzy math) only takes things so far. When the correction occurs, there isn’t a warning. In fact, there is always a lot of high-level rhetoric reassuring everyone, while behind the scenes the smart money is cashing in as much as they can as fast as they can. And that is why I’m encouraging everyone to make sure that you are safe and protected now. If you lost more than half in the Great Recession, and you haven’t made any changes to your strategy, you are as vulnerable today as you were then. The safe side of your portfolio is even more vulnerable. There are safe, easy, time-efficient, time-proven strategies that earned gains in the last two recessions, outperformed the bull markets in between and are easy-as-a-pie-chart. You can also save thousands of dollars every year with smarter energy, budgeting and investing choices (without a loss of life style), when you stop making the billionaires rich at your own expense. Wisdom is the cure. Call 310-430-2397, or email info @ NataliePace.com to learn more. Join me on my teleconference this Thursday at 9 am PT (noon ET) for an interactive conversation on financial engineering, where I am happy to answer your questions. If you want to protect your assets before summer (and frolic in the warm Atlantic with new friends), then join me at my June 10-12, 2017 Oceanfront Florida Financial Empowerment Retreat. Only a few seats remain available.  Should You Sell in May and Go Away? As we enter the 9th year of the current bull market (something akin to unicorns, historically), it’s definitely time to ask ourselves, “Should I sell in May and go away on holiday?” Is this the time to take profits, count blessings, get a little defensive and take an epic vacation? Below are a few considerations.
And here are details on each of these considerations.
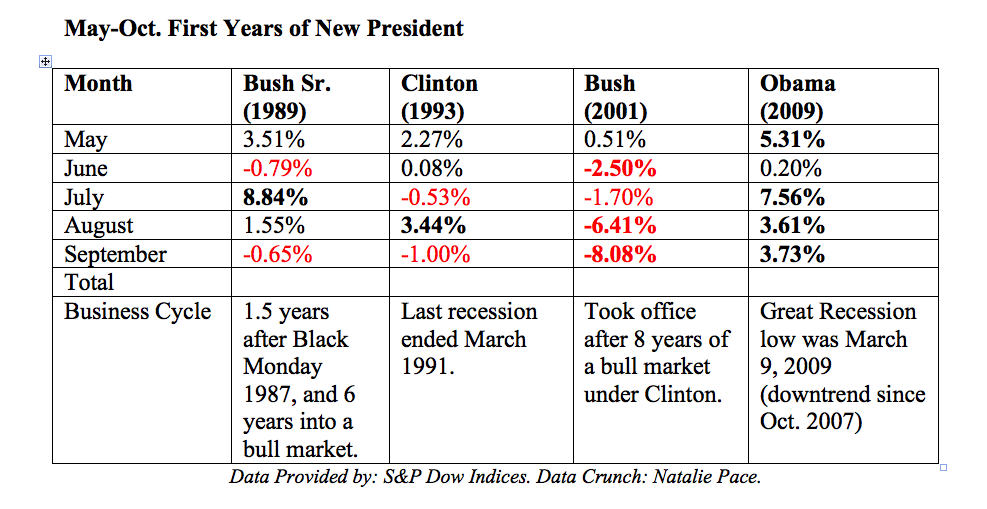
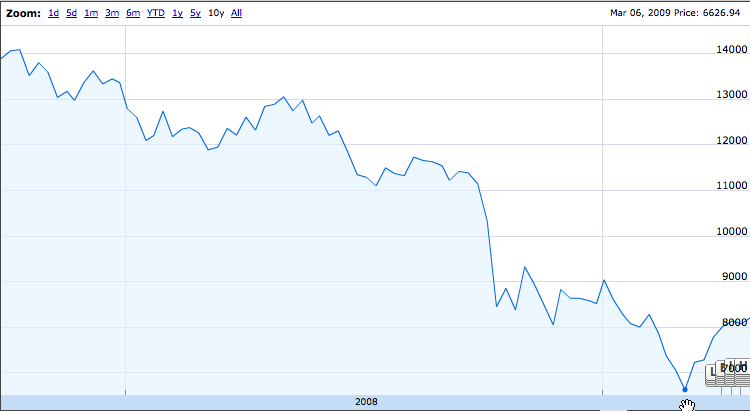
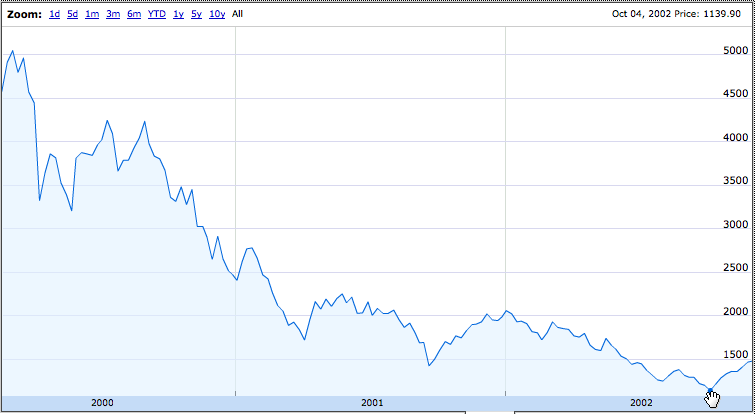
2. How Do the Markets Perform May-October Under First Time Presidents? As you can see from the chart below, the performance is more affected by the business cycle, than it is by the President. President George W. Bush had a terrible time his first year. However, he inherited an economy that was ripe for a recession. The U.S. had experienced eight years of prosperity under President Clinton. NASDAQ was a bubble that was ready to pop. When President Obama took office, the U.S. was near the bottom of the Great Recession (the exact bottom was March 9, 2009). There was nowhere to go but up. This year marks the 9th year of the current bull market – a difficult time for market gains, historically. 3. How’s the Economy Doing These Days? The predictions are for very slow growth, at just 2.1% GDP growth for 2017. (No one ever predicts a recession.) The 1st quarter 2017 GDP growth was the lowest it has been in years, at 0.07%. Other issues include: $20 trillion in public debt, over $66 trillion in total U.S. Debt and Loans, and business, governments and people who are borrowing from Peter to pay Paul to try and make ends meet. 4. What Positive or Negative Events Are on the Horizon? The current Budget funds government only through September 30, 2017. The U.S. Treasury Secretary is currently using extraordinary means to pay bills because the Debt Ceiling has been hit again. If the Debt Ceiling isn’t raised before the U.S. runs out of money to pay bills, then Fitch Ratings might downgrade the U.S. credit. The new budget and Debt Ceiling will have to be resolved in September to avoid all of this. The last time that Congress raised the Debt Ceiling, House Speaker John Boehner lost his job. He had to enlist the support of Democrats to get the Debt Ceiling raised. While the bipartisan Budget that was just passed makes it seem possible that all of this can get done, everyone is mum on the issues. If you wait for the headlines this fall, and they turn out to be contentious or problematic, it will be too late to protect yourself. 5. What’s Fueling the Bull Market? Free, easy money (for corporations and countries, but not individuals or small businesses). Corporate buybacks. Financial engineering. For more on this, tune into my May 25, 2017 teleconference. Get call in instructions and listen back 24/7 on demand at http://www.BlogTalkRadio.com/NataliePace. 6. What Other Opportunities Exist for Investors? The best opportunities today are safe, income-producing hard assets that you purchase for a good price. Real estate is more expensive in many areas than it was before the real estate bubble burst in the Great Recession. So, income property is not necessarily a good price right now (although it might be in some areas that have not experienced a return to the pre-Recession highs). Most of the best areas of opportunities lie in purchases you can make now to reduce the money that you spend monthly on big ticket items like housing, transportation, electricity, insurance, medical insurance, etc. (This is another major area of focus at my Investor Educational Retreats.) 7. What’s at Stake? The last two times that the U.S. economy went 8 years without a correction, the economy crashed. Investors lost more than half in the Great Recession (and over 7 million people also lost their homes), and more than 3/4ths in the Dot Com Recession. This economy is far more fragile than it was in either of those two recessions, with all of the debt that abounds. Performance of the Dow Jones Industrial Average Index from Oct. 2007 to March 2009 Performance of the NASDAQ Composite Index from March 2000 to October 2002. Access my teleconference, "Should You Sell in May and Go Away?" at http://www.BlogTalkRadio.com/NataliePace/2017/05/05/sell-in-may-and-go-away. About Natalie Pace Natalie Wynne Pace is the co-creator of the Earth Gratitude project and the author of the Amazon bestsellers The Gratitude Game, The ABCs of Money and Put Your Money Where Your Heart Is (aka You Vs. Wall Street). She has been ranked as a No. 1 stock picker, above over 835 A-list pundits, by an independent tracking agency (TipsTraders). The ABCs of Money remained at or near the #1 Investing Basics e-book on Amazon for over 3 year (in its vertical). |
AuthorNatalie Pace is the co-creator of the Earth Gratitude Project and the author of The Power of 8 Billion: It's Up to Us, The ABCs of Money, The ABCs of Money for College, The Gratitude Game and Put Your Money Where Your Heart Is. She is a repeat guest & speaker on national news shows and stages. She has been ranked the No. 1 stock picker, above over 830 A-list pundits, by an independent tracking agency, and has been saving homes and nest eggs since 1999. Archives
July 2024
Categories |


 RSS Feed