|
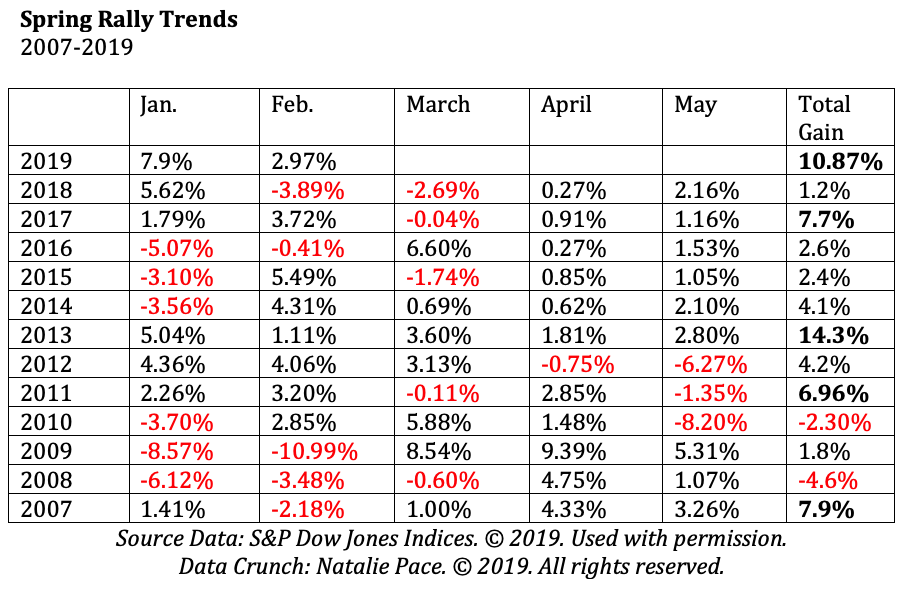
Today, the Dow Jones Industrial Average dropped 460 points, marking the worst day-drop since the 660-point drop on January 3, 2019. And both of these plummets were preceded by the worst December since the Great Depression. Is the Spring Rally over? The good news is that the recent tax cuts sparked 2018 to the fastest economic growth the U.S. has seen since 2006, at 2.9% and 3.3%, respectively. The bad news is that wasn’t matched with spending cuts, so the public debt is higher than its ever been – at $22 trillion. On Wednesday, the Federal Reserve Board indicated there will be no interest rate hikes this year, and that they will stop deleveraging their own balance sheet at the end of this September. That seems like good news on the surface, particularly for interest-rate sensitive industries, like housing, and leveraged corporations that need to borrow money. However, since two of the primary economic concerns are overleverage (too much debt) and pricey valuations (bubbles), and since low interest rates contribute to bubbles and borrowing, continuing an accommodative stance risks exacerbating those two problems. Alan Greenspan, Warren Buffett, Robert Shiller and many other economists have all gone on record saying that stocks and bonds are in a bubble. Click to read through 12 Economic Concerns outlined in the Financial Stability Report that was released on November 28, 2018. Also, having the Fed Fund Rate at just 2.25-2.50% doesn’t give the Federal Reserve much room to lower rates, and goose the economy, when things head south. The most recent GDP growth projections are for 2.1% growth in 2019 and 1.9% in 2020 – much lower than 2018’s 2.9% – which is why the Federal Reserve is pausing on their interest rate hikes. The 1st quarter 2019 GDP growth is predicted to be downright dismal – at 1.2-1.3%. What Does All of This Mean for the Spring Rally 2019? After the worst December (2018) on Wall Street since the Great Depression (1931) -9.13 and -14.53% in the S&P500 respectively, Wall Street came roaring back. The Dow Jones Industrial Average is up 10.5% since the beginning of the year. Can the rally continue? Should you lean into the returns assuming there will be more wind at your back? Or is it time to take cover into a defensive position, and do a full assessment of the level of risk in your current plan? To answer these questions, I did a big data crunch to determine… * How well do March, April and May perform, when January and February are strong? * Do they continue the trend or give back some of the gains? * Is the pre-election year a rocket booster or a headwind on the Spring Rally? And here’s what the 10-Year Data revealed. * Most of the time when January and February are strong, the Spring Rally (including May) is weak. * The average gains for the first five months of the year are 4.3%. * The years with the strongest starts had the weakest growth, while the years with the stronger growth had negative (2010) or low performance (2015) in the first five months. * The pre-election year is usually great for the Spring Rally. 2007 gained 7.9% in the 1st five months of the year, while 2011 saw a solid 7% jump over that same period. In 2015, however, returns were tepid, at 2.4%. 10.5% gains (January 1, 2019 – March 21, 2019) is much higher than the average performance. There was only one year, in 2013 with 14.3% gains during the first five months of the year. So, historical performance trends would suggest a weak Spring Rally, giving back some of the gains of January and February. Pre-election trends are not as reliable today as they were in the past. The 10-year average is a loss of -0.37%, while the 20-year average is 15.58% gains. Another interesting point is that two of the strongest 5-month starts on Wall Street, in 2013 and 2011, came with forward projections of an improving economy. The recent projections were revised downward to a very slow growth of 2.1% growth in 2019. Wall Street veterans are always forward-thinking. So, today’s sell-off isn’t surprising. April 26, 2019 is a Big Day for Bad News On April 26, 2019, we’ll get the advance numbers for GDP growth in the first quarter of this year. Economists are projecting growth between 0.4% and 1.4%. That is significantly lower than the 4th quarter 2018 growth of 2.6%. Investors typically don’t respond well to such a sharp slowdown. The Most Predictable Recession Indicator Just Flashed Red The yield curve just inverted today, with the 10-year treasury falling .03 percentage points below the 3-month treasury yield of 2.46%. An inverted yield curve is 100% correlated with recessions over the past half a century. Buybacks Dry Up During the Quiet Period Bloomberg reported on March 20, 2019 that corporations had ceased buying back their own stock – a key driver of this entire bull market – and would stay on the sidelines throughout the 5-week quiet period before earnings announcements – through mid-April. As you can see from the below chart of buybacks, corporations purchasing their own stock is a perfect mirror of Wall Street performance. Purchases were at a high when Wall Street spiked in October. Both hit the pits at the end of December, only to rally strong through the first two months of 2019. Corporate buybacks are clearly driving Wall Street’s performance. In short, there are far more red flags than green lights on Wall Street for the Spring Rally. December 2018 reminds us that when the winds change, losses can cut like a falling knife. The right answer is never all in or all out, but is, rather, a diversified plan that keeps enough safe, underweights the overleveraged companies and adds in performance. A well-diversified plan that is annually rebalanced forces you to do what you must do for successful investing in today’s world – buy low and sell high on auto-pilot in your nest egg. The days of Buy and Hope paying off ended in 1999. 2018 was a year when stocks and bonds lost money, which means that 2019 is the year that you need to know what you own, know what a healthier plan looks like and take charge – being the boss of your money. Below is a list of the Economic Red Flags present in today’s economy… Economic Red Flags Prices are too high. Debt is too high. Growth is too slow. Productivity is too sluggish. There is an $879 billion U.S. trade deficit (2018 FY). $22 trillion U.S. public debt (as of 3.22.19). The Debt Ceiling was hit 3.1.19. X date should land in Aug/Sept/Oct. 1Q 2019 GDP will be released on April 26, 2019. It is predicted to be 0.4% - 1.5%. The Feds have paused on rate hikes, and will stop balance sheet deleveraging at the end of September. Consumer and fixed income spending are softening. U.S. GDP is $20.9 trillion, while Debt is $22 trillion. If you wait for the headlines on these red flags, it will be too late to protect yourself. You don’t have to understand economics to employ a time-proven easy-as-a-pie chart nest egg strategy that earned gains in the last two recessions (when most people lost more than half) and outperformed the bull markets in between. Blind faith that someone else is doing this for you can be very expensive. (It’s a good idea to get a second and third qualified, unbiased opinion on your current plan, rather than just trusting that your money manager has protected you.) Wisdom is the cure. (Click to read more about the High Cost of Free Advice.) As the landscape changes rapidly, time proven systems will be your ally. Join me at my Colorado Investor Edu Retreat, where we’ll examine how to protect your assets, learn what's safe in a world where stocks and bonds are in a bubble and invest profitably in high growth opportunities (like cannabis). Call 310-430-2397 or email info @ NataliePace.com to learn more about the retreat, or to request an unbiased second opinion on your current budgeting and investing plan! Other Blogs of Interest
The Lyft IPO Hits Wall Street. Should you take a ride? Cannabis Doubles. Did you miss the party? 12 Investing Mistakes Drowning in Debt? Get Solutions. What Hot in 2019? The Debt Ceiling Was Hit (Again) on March 1, 2019. How Bad Will the GDP Report Be? 2019 Investor IQ Test The State of the Union CBD Oil for Sale. The High Cost of Free Advice. Apple's Real Problem in China: Huawei. 2019 Crystal Ball. 2018 is the Worst December Ever. Will the Feds Raise Interest Rates? Should They? Learn what you're not being told in the MSM. Why FANG, Banks and Your Value Funds Are in Trouble. When the Santa Rally is a Loser, the Next Year is a Bigger Loser. Russia Dumps Treasuries and Buys Gold OPEC and Russia Cut Oil Production. Trade Deficit Hits an All-Time High. Wall Street Plunges 800 Points. How to Protect Yourself. Rebalance and Get Safe in December. Here's Why. The Best Investment Decision I Ever Made. What's Safe for Your Cash? FDIC? SIPC? Money Markets? Under the Mattress? The Real Reason Stocks Fell 602 Points on Veterans Day 2018. Will Ford Bonds Be Downgraded to Junk? 6 Risky Investments. 12 Red Flags. 1 Easy Way to Know Whom to Trust With Your Money. Whom Can You Trust? Trust Results. October Wipes Out 2018 Gains. Will There Be a Santa Rally in 2018? The Dow Dropped 832 Points. What Happened? Bonds are In Trouble. Learn 5 Ways to Protect Yourself. Interest Rates Projected to Double by 2020. 5 Warning Signs of a Recession. How a Strong GDP Report Can Go Wrong. Should I Invest in Ford and General Electric? Important Disclaimers Please note: Natalie Pace does not act or operate like a broker. She reports on financial news, and is one of the most trusted sources of financial literacy, education and forensic analysis in the world. Natalie Pace educates and informs individual investors to give investors a competitive edge in their personal decision-making. Any publicly traded companies or funds mentioned by Natalie Pace are not intended to be buy or sell recommendations. ALWAYS do your research and consult an experienced, reputable financial professional before buying or selling any security, and consider your long-term goals and strategies. Investors should NOT be all in on any asset class or individual stocks. Your retirement plan should reflect a diversified strategy, which has been designed with the assistance of a financial professional who is familiar with your goals, risk tolerance, tax needs and more. The "trading" portion of your portfolio should be a very small part of your investment strategy, and the amount of money you invest into individual companies should never be greater than your experience, wisdom, knowledge and patience. Information has been obtained from sources believed to be reliable however NataliePace.com does not warrant its completeness or accuracy. Opinions constitute our judgment as of the date of this publication and are subject to change without notice. This material is not intended as an offer or solicitation for the purchase or sale of any financial instrument. Securities, financial instruments or strategies mentioned herein may not be suitable for all investors.
Sean Morris
23/3/2019 08:44:25 am
Interesting, great info thank you! I’m curious about the treasury yeild curve and why it’s the number one indicator of recession? 23/3/2019 10:00:45 am
Thanks for the feedback and the Q, Sean. I'll answer it in the May teleconference (so be sure to listen in). FYI: The April teleconferences are all with other experts, so we'll be focusing on sustainability and gold in those... One more thing. The correlation between an inverted yield curve and recession is 100% over the last half century. You can see that chart at this link. Click on Max to see the full picture. Comments are closed.
|
AuthorNatalie Pace is the co-creator of the Earth Gratitude Project and the author of The Power of 8 Billion: It's Up to Us, The ABCs of Money, The ABCs of Money for College, The Gratitude Game and Put Your Money Where Your Heart Is. She is a repeat guest & speaker on national news shows and stages. She has been ranked the No. 1 stock picker, above over 830 A-list pundits, by an independent tracking agency, and has been saving homes and nest eggs since 1999. Archives
July 2024
Categories |


 RSS Feed