Natalie Pace Blogs

Photo of Natalie Pace by Marie Commiskey. Avalon Photography.
|
|
|
|
|
|
|
|
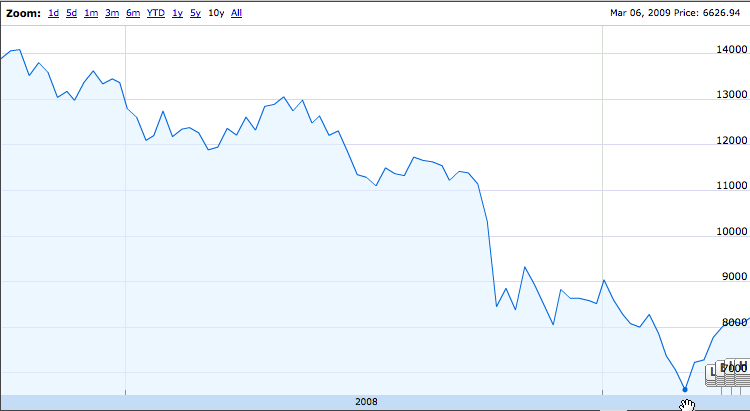
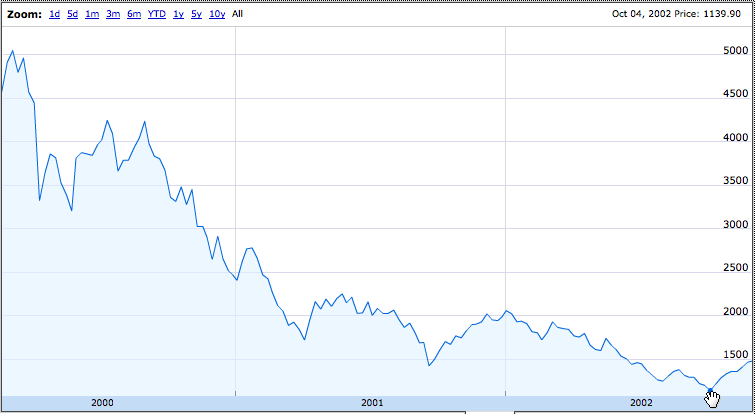
 Natalie Pace in Ireland. Photo by Marie Commiskey. Avalon Photography. (c) 2012. All rights reserved. Discover why pie charts, not just account summary pages, are essential to successful investing. This strategy taps your emotions to work for you rather than against you. If you are looking at statements and adhering to a Buy and Hope plan, your feelings are jacked between euphoria, desperation and indigestion, and are very likely demanding that you do the wrong thing. Most investors have lost more than half of their nest egg in the last two market contractions. Our nest egg pie chart and annual rebalancing plan earned gains in the last two recessions and have outperformed the bull markets in between. So, in addition to this being an emotionally healthy plan, it’s also time-proven. Recently someone reached out to my office for some private coaching and a second opinion. Heather, my assistant, asked if they had mocked up their holdings into a pie chart. The response was, “No, I don’t need a pie chart. I’m just going to ask her what she thinks of my stocks.” This is the wrong approach for many reasons. And here’s why. Harnessing the power of your emotions When you look at summary pages, your emotions are going to be working against you, quite powerfully. The summary page will show gains and losses in your positions. The losses will be in red. The games will be in green. Most of us associate red with stop and green with go. If you use stop losses or sell when something loses value, then you are adopting a sell low plan. If you applaud your gains and hit the gas on the green light, rather than capturing your gains, then you might watch them skid into losses at the next red light. You are also more likely to buy high. Buying high and selling low is the exact opposite of what successful investors do. Our emotional response to losses is fear and loathing. Our emotional response to gains is jubilee. So, in addition to the rote response we have to red and green lights, we’ve now got adrenalin fueling us in the wrong direction. The Power of a Simple Pie Chart When we put our holdings into a pie chart everything changes. What was a liability becomes an asset. If you have a fund that has lost money, the pie chart slice will be thinner. If you have a fund that has massive gains, the pie chart slice will balloon in size. The visual prompts you to do what you’re supposed to do, which is to buy low and sell high. You have to buy more of the thin slice in order to be properly diversified. You’ll be capturing gains (selling high) in the funds that have rocketed up in share price, so that you will not be overleveraged in them. Annual rebalancing is a Buy Low and Sell High Plan on Auto Pilot for Your Nest Egg At my retreats, I teach that rebalancing your nest egg 1-3 times a year is an essential part of a successful strategy in today’s Debt World. Rebalancing is easy. Simply mock up what you have into a pie chart. Mock up what you should have into another pie chart. Then make what you have look like what you should have. Always take the time to freshen up your pie chart with current data before you consider what action you are going to take. The visual itself will be your guide. 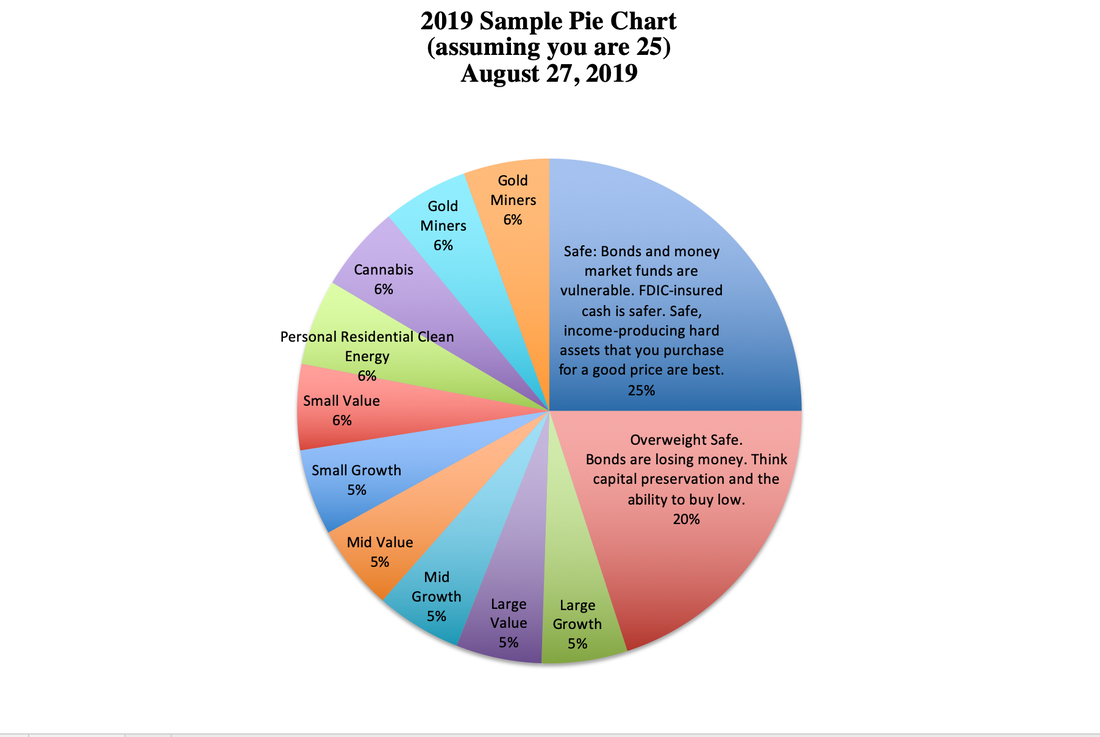 Nest Egg Pie Charts (r) 2006. Natalie Pace. All rights reserved. Get an Unbiased 2nd Opinion Some people have trouble mocking up what they have into a pie chart, and that is where my 2nd opinions can be helpful. Once you know how to do this, by observing how I did it, then your rebalancing will be easy and efficient. Sadly, you cannot rely upon your broker to do this for you. The pie charts supplied by most brokerages is not an accurate picture of what you own. The Pie Chart You Receive from your Brokerage Won’t Help You I’ve been doing 2nd opinions for over a year now. To date, I have not found one summary page with a pie chart on it that was an accurate representation of what the person really held. If you have pages and pages of holdings, and particularly if you have a lot of individual stocks, if the brokerage does supply a pie chart, they are likely just going to lump all of the stocks into “equity” and then put your bonds into “fixed income.” This is not helpful because you cannot see and capture your gains, as you can when you know clearly which funds are small, medium and large, and which are value and growth. Also, this type of plan is often just the same types of holdings over and over again, so you are not properly diversified, even if you have pages and pages of holdings. (In fact, this is a red flag that you’re getting killed in brokerage fees.) If you have less than a few hundred thousand dollars in your 401K, IRA or brokerage account, you may only own one or two funds. The pie charts supplied will try to show that the one or two funds you own are diversified by mocking up the various holdings within that fund. However, annual rebalancing doesn’t work when you have one or two “everything and the kitchen sink” funds because you can’t see and capture your gains. You have an amoeba type situation. You never know which areas of your plan are getting thinner or bigger (with losses and gains). Even if you did you would not be able to rebalance it because the fund manager has complete control over the holdings. You own one big glob of a fund that you basically have to just watch go up and down on the Wall Street rollercoaster that most investors have endured since 2000.
Most Main Street investors are not properly diversified – not in their 401K, IRA or their managed account. Most of the plans that I’ve reviewed have no exposure to hot industries. Few people are aware of the risk that lies on the “safe” side of their portfolio this year. What is Hot and What is Safe Changes Every Year What’s hot and what is safe changes annually. So, when you’re doing your annual rebalancing, it’s important to consider both of these areas carefully, based upon data and information from a trustworthy source with an impeccable track record. Friends, family and your financial advisor qualify only if they have a Ph.D. in results for a minimum of 15 years. Many bloggers and writers don’t qualify at all. For instance, Chinese technology was the hottest thing going a few years ago. When FANG (Facebook, Apple, Netflix and Google) was scoring big-time, smart investors were also looking at BAT (Baidu, Alibaba and Tencent), where the gains were even more impressive. This year, with the trade war between China and the United States, Chinese stocks have suffered. If you had captured your gains in 2017, when these stocks doubled, then you’d be on the right side of this trade. You are expecting higher performance in the four hot slices of your nest egg. This is the place for experimenting, within reason, with the assets, industries and countries that you believe will outperform everyone else. As another example, gold mining ETFs have doubled over the past year. However, they are still down significantly from their all-time highs which were in 2012. Gold is a good hedge against a market downturn. If confidence in the economy and stocks weaken, that should be positive for gold. So, this year, even though those funds have doubled. you might want to take your profits and keep a slice or two in this area, rather than sell off the entire position. As I’ve mentioned many times, most people lost more than half of their assets in the last two recessions. This pie chart system far out performs the market, protects your assets (if you adopt this year’s safest strategy), limits any losses and offers a time-proven plan that ensures you can sleep at night. It costs less time and money than your current plan. The only real question is how are you going to learn The ABCs of Money that we all should have received in high school, so that you can be the boss of your money, instead of having to operate with blind faith? Learn how to save thousands annually in your budget with smarter big-ticket energy choices, and how to invest in your nest egg with a time-proven strategy that earns gains in recessions and outperforms the bull markets in between. Join me at one of my upcoming Investor Educational Retreats. You have 3 to choose from below. Arizona is my most affordable retreat. Students register for 1/2 off! Anyone who registers for the Florida or England Retreat by October 31, 2019 receives the lowest price. Call 310-430-2397 or email [email protected] to learn more now.
Other Blogs of Interest What the Ford Downgrade Means for Main Street. The Dow Dropped Over 1000 Points Tesla's 3Q 2019 Deliveries Could Hit 100,000. Do We Talk Ourselves into Recessions? Interview with Nobel Prize Winning Economist Robert J. Shiller. The Winners and Loser of a Clean Energy Policy. Make the Climate Strike Personal. Ford is Downgraded to Junk. From Buried Alive in Bill to Buying Your Own Island. The Manufacturing Recession. An Interview with Liz Ann Sonders. Gold Mining ETFs Have Doubled. The Gold Bull Market Has Begun. The We Work IPO. The Highs and Hangovers of Investing in Cannabis. Recession Proof Your Life. China Takes a Bite Out of Apple Sales. Will the Dow Hit 30,000? A Check Up on the Economy Red Flags in the Boeing 2Q 2019 Earnings Report The Weakening Economy. Think Capture Gains, Not Stop Losses. Buy and Hold Works. Right? Wall Street Secrets Your Broker Isn't Telling You. Unaffordability: The Unspoken Housing Crisis in America. Are You Being Pressured to Buy a Home or Stocks? What's Your Exit Strategy? Will the Feds Lower Interest Rates on June 19, 2019? Should You Buy Tesla at a 2 1/2 Year Low? It's Time To Do Your Annual Rebalancing. Cannabis Crashes. Should You Get High Again? Are You Suffering From Buy High, Sell Low Mentality? Financial Engineering is Not Real Growth The Zoom IPO. 10 Rally Killers. Fix the Roof While the Sun is Shining. Uber vs. Lyft. Which IPO Will Drive Returns? Boeing Cuts 737 Production by 20%. Tesla Delivery Data Disappoints. Stock Tanks. Why Did Wells Fargo's CEO Get the Boot? Earth Gratitude This Earth Day. Real Estate is Back to an All-Time High. Is the Spring Rally Over? The Lyft IPO Hits Wall Street. Should you take a ride? Cannabis Doubles. Did you miss the party? 12 Investing Mistakes Drowning in Debt? Get Solutions. What's Hot in 2019? The Debt Ceiling Was Hit (Again) on March 1, 2019. How Bad Will the GDP Report Be? 2019 Investor IQ Test The State of the Union CBD Oil for Sale. The High Cost of Free Advice. Apple's Real Problem in China: Huawei. 2019 Crystal Ball. 2018 is the Worst December Ever. Will the Feds Raise Interest Rates? Should They? Learn what you're not being told in the MSM. Why FANG, Banks and Your Value Funds Are in Trouble. When the Santa Rally is a Loser, the Next Year is a Bigger Loser. Russia Dumps Treasuries and Buys Gold OPEC and Russia Cut Oil Production. Important Disclaimers Please note: Natalie Pace does not act or operate like a broker. She reports on financial news, and is one of the most trusted sources of financial literacy, education and forensic analysis in the world. Natalie Pace educates and informs individual investors to give investors a competitive edge in their personal decision-making. Any publicly traded companies or funds mentioned by Natalie Pace are not intended to be buy or sell recommendations. ALWAYS do your research and consult an experienced, reputable financial professional before buying or selling any security, and consider your long-term goals and strategies. Investors should NOT be all in on any asset class or individual stocks. Your retirement plan should reflect a diversified strategy, which has been designed with the assistance of a financial professional who is familiar with your goals, risk tolerance, tax needs and more. The "trading" portion of your portfolio should be a very small part of your investment strategy, and the amount of money you invest into individual companies should never be greater than your experience, wisdom, knowledge and patience. Information has been obtained from sources believed to be reliable however NataliePace.com does not warrant its completeness or accuracy. Opinions constitute our judgment as of the date of this publication and are subject to change without notice. This material is not intended as an offer or solicitation for the purchase or sale of any financial instrument. Securities, financial instruments or strategies mentioned herein may not be suitable for all investors. 1/11/2019 06:41:10 am
I am a new investor in online business like <a href="https://familyhw.com/best-sushi-rice-brand/">sushi rice brands</a>. Hope that to receive your financial advice. 24/8/2020 07:02:06 am
Pretty wise and educational material on your blog I have found in detail that is really great. The people who are looking for such successful investment plan they can get the stuff and improve their knowledge about as well. Thank you and keep sharing such reliable source with us. Comments are closed.
|
AuthorNatalie Pace is the co-creator of the Earth Gratitude Project and the author of The Power of 8 Billion: It's Up to Us, The ABCs of Money, The ABCs of Money for College, The Gratitude Game and Put Your Money Where Your Heart Is. She is a repeat guest & speaker on national news shows and stages. She has been ranked the No. 1 stock picker, above over 830 A-list pundits, by an independent tracking agency, and has been saving homes and nest eggs since 1999. Archives
July 2024
Categories |


 RSS Feed